
👋 Welcome , I'm Micheal Okeowo
and
I make data talk 📈
👨🎓Google Certified Data Analyst
💻 MySQL, Tableau, R, Excel
⚽Sports, 🏋🏽Fitness, 🎮Gaming
Technical skills
MySQL
R
Tableau
Excel(Advanced)
Data Cleaning
Data Modeling
Statistical Analysis
Projects
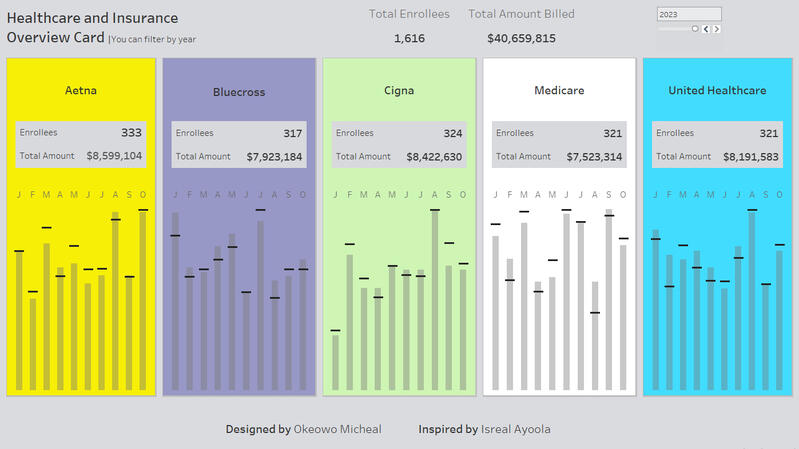
Healthcare and insurance overview card
Tableau | Data Visualization
Created an interactive dashboard after analyzing 10,000 rows of healthcare data to derive insights
Used Bar charts, Gantt charts, KPIs to show yearly performance of different insurance providers

Fitbit Data analysis with R
R
Real-World Health Data: Explored activity, sleep, and weight data from 30 Fitbit users.
Data Cleaning & Transformation: Prepared the data for analysis using R's tidyverse.
Key Metrics: Calculated and visualized daily averages for steps, calories, sleep, and sedentary time.
Trend Analysis: Examined patterns in activity levels and sleep over time.
Data Visualization: Created informative plots (scatter plots, bar charts) to illustrate findings.
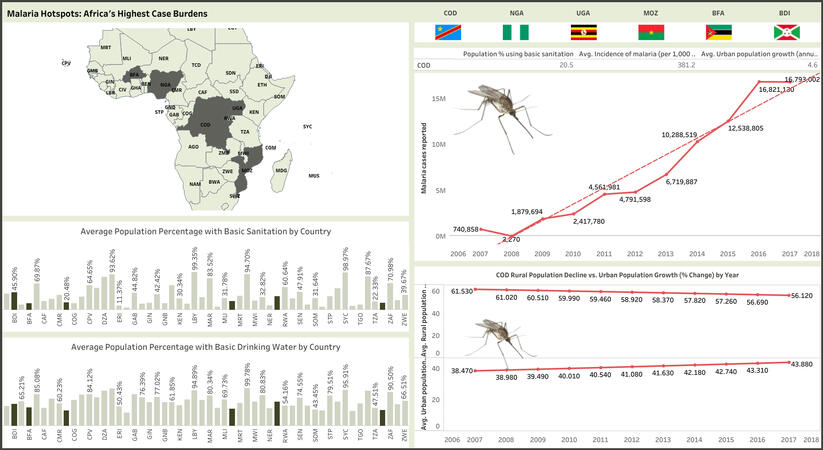
Malaria Hotspots: Africa's Highest Case Burdens
Tableau |Exploratory Data Analysis
Real world data
Evaluated Africa malaria reports between the year 2007 and 2017
Created an interactive dashboard to highlight the top countries with highest case burdens over the years
Used maps, line charts, bar charts to show positions, trends and relationships.

The IPL Chronicles: A Visual Journey into Team Success and Player Triumphs
Tableau | Data Visualization
Real world data
Analyzed 12 seasons data of the Indian premier league to identify successful teams, players and trends.
Identified factors influencing match winner
Created an Interactive dashboard to show findings.
Utilized line charts, area charts and Bar charts to show trends and rank teams/players.
About Me


Hey there!I fell in love with data while leading a university research project, sparking a passion that led me from public health into data analytics. Now, I'm obsessed with uncovering the stories hidden within data. My public health background allows me to understand not just the numbers, but the people behind them.When I'm not immersed in data, you can usually find me on the soccer field, at the gym, getting lost in a video game, or out for a run.Let's connect and explore how my data-driven approach can benefit you.Proficiencies:- MySQL
- R
- Tableau
- Excel(Advanced)
- Data Cleaning
- Data Modeling
- Statistical Analysis
current role: Business analyst - turingPrevious Experience
THE SPARK FOUNDATION
Data Analyst intern | November 2023
Increased student performance by 15% by conducting a linear regression analysis in R to predict the impact of study hours on student scores, leading to the creation of a structured study program and an average GPA increase of 0.5 points.
Improved team management and sponsorship investments by analyzing 12 seasons of Indian Premier League data, identifying top-performing teams and players, and increasing match-winning probability by 10%.
Boosted company market share by 10% by guiding product strategy through data-driven identification of influential teams and players.
Enhanced decision-making efficiency by 25% and productivity by 30% by developing an interactive dashboard for stakeholders to access and analyze key performance metrics.